Buildings
Whilst many attributes can fall under this umbrella of data, the primary goal is to obtain good building footprints for a region of interest. If there is additional data, (e.g. LiDAR height data) or categorisation of buildings (e.g. retail, commercial, residential), then wombat will provide that information as well.
First what we need are good building footprints.
Open Street Map
OpenStreetMap (OSM) is a free, open geographic database updated and maintained by a community of volunteers via open collaboration. There are hundreds of tools to interact with this dataset and obtain their building information.
pyrosm
One of the main tools to obtain OSM building information is via pyrosm. As per their documentation:
Pyrosm is a Python library for reading OpenStreetMap from Protocolbuffer Binary Format -files (*.osm.pbf) into Geopandas GeoDataFrames. Pyrosm makes it easy to extract various datasets from OpenStreetMap pbf-dumps including e.g. road networks, buildings, Points of Interest (POI), landuse, natural elements, administrative boundaries and much more. Fully customized queries are supported which makes it possible to parse any kind of data from OSM, even with more specific filters.
This access is as follows.
%load_ext autoreload
%autoreload 2
from pyrosm import OSM
from pyrosm import get_data
fp = get_data("test_pbf",directory=os.path.join(os.environ['WOMBAT_DATA_PATH'],"pbf"))
# Initialize the OSM parser object
osm = OSM(fp)
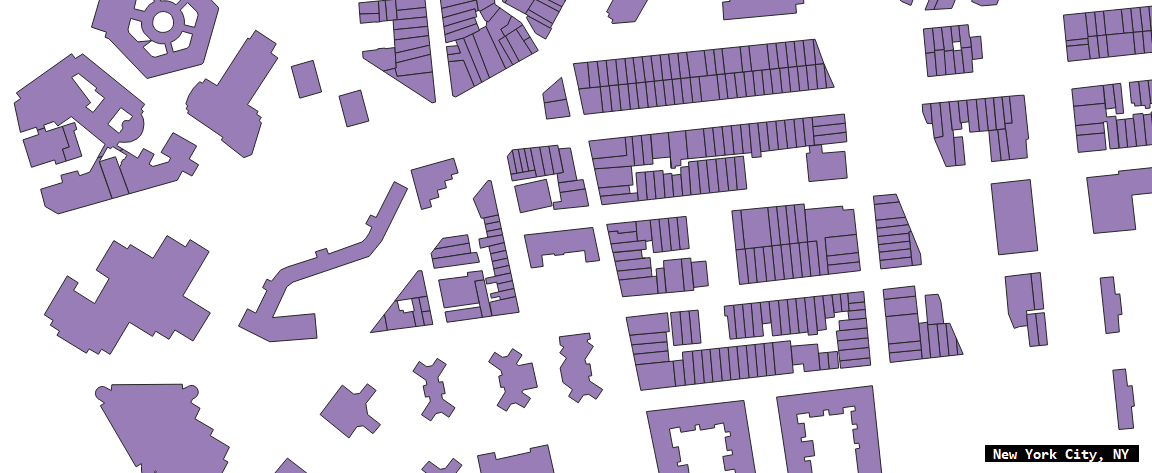
buildings = osm.get_buildings()
buildings.plot()
The autoreload extension is already loaded. To reload it, use: %reload_ext autoreload
<Axes: >

# By default pyrosm reads all elements having "amenity", "shop" or "tourism" tag
# Here, let's read only "amenity" and "shop" by applying a custom filter that
# overrides the default filtering mechanism
custom_filter = {'amenity': True, "shop": True}
pois = osm.get_pois(custom_filter=custom_filter)
# Gather info about POI type (combines the tag info from "amenity" and "shop")
pois["poi_type"] = pois["amenity"]
pois["poi_type"] = pois["poi_type"].fillna(pois["shop"])
# Plot
ax = pois.plot(column='poi_type', markersize=3,
figsize=(5,5),
legend=True,
legend_kwds=dict(loc='upper left',
ncol=3,
bbox_to_anchor=(1, 1)))

Whilst this dataset has great potential, the downside is that it is incomplete.
Incompleteness
The challenge with OpenStreetMap is that whilst it contains a wealth of data, ultimately it is incomplete. For our purposes, it is incomplete in two ways that impact the utility of it in wombat.
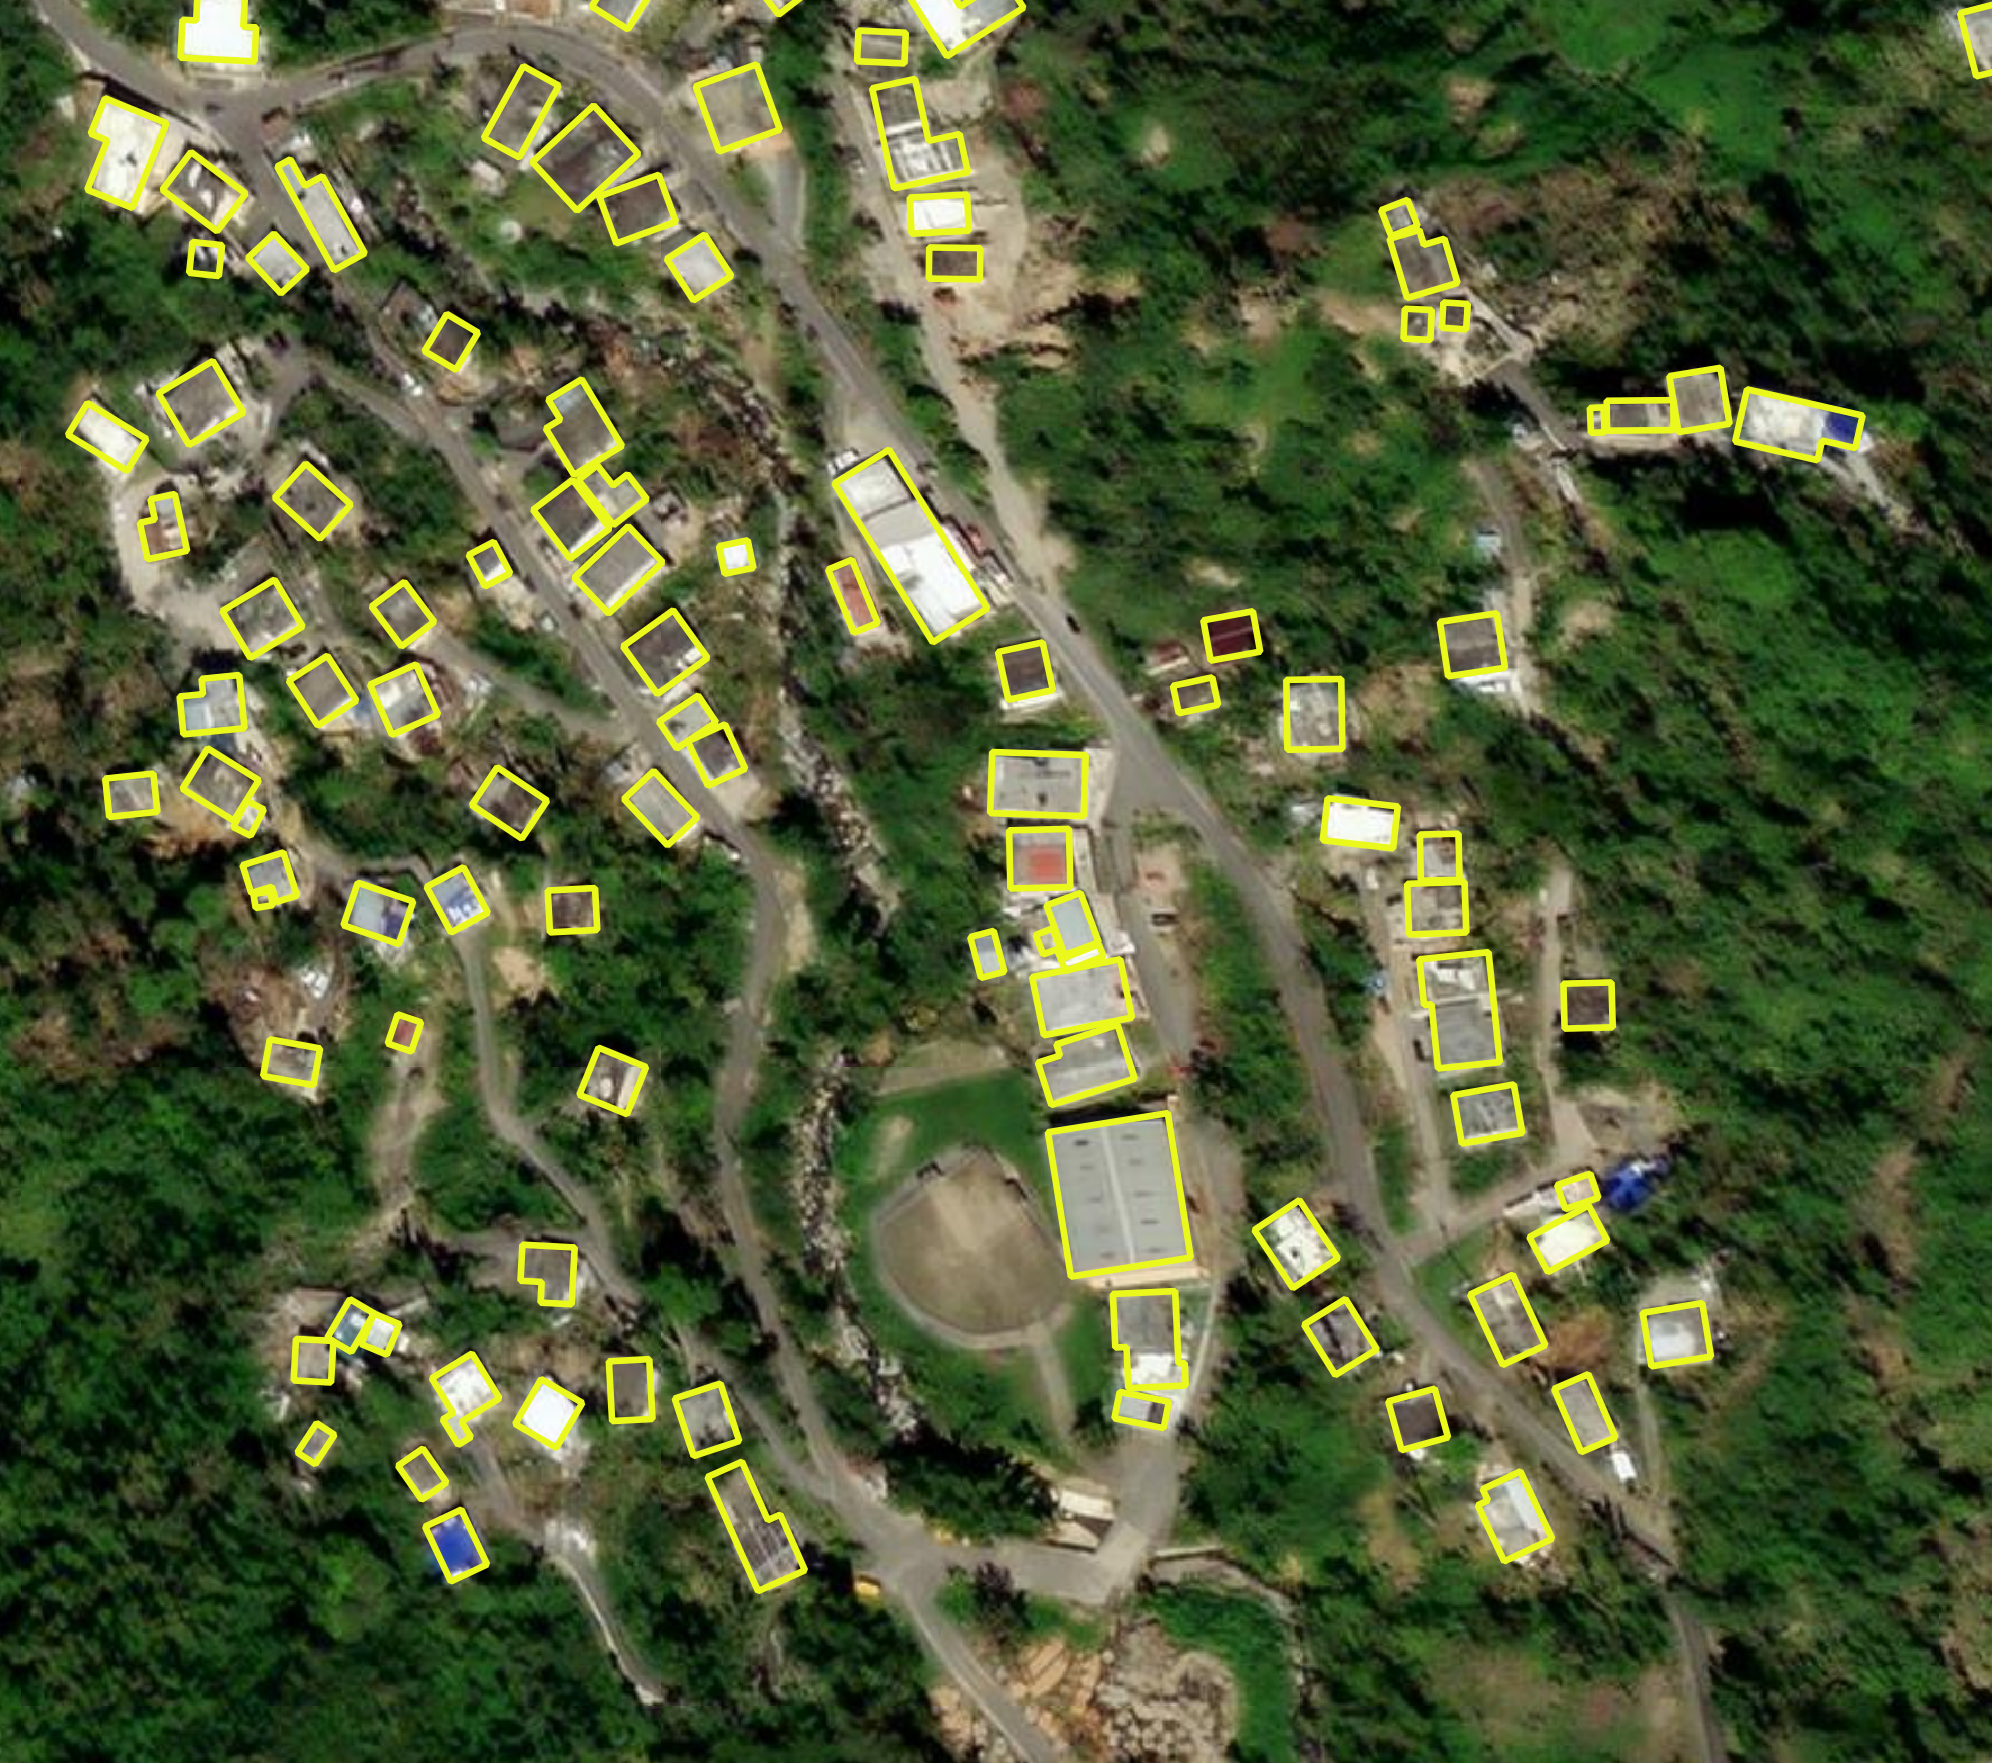
To demonstrate this, one only has to zoom to any suburb >10km from the CBD and the structures marked falls of drastically. We need a method to make up this drop off in data, particularly outside the CBD of the major cities.
We can directy examine the extent of the incompletness by comparing to Google's building footprints next to OpenStreetMap.
%load_ext autoreload
%autoreload 2
import wombat
# create a city
city = wombat.City("Brisbane")
# initialise wombat
w = wombat.Wombat(dataset_path=os.environ['WOMBAT_DATA_PATH'],
zoom=18,
center=[city.lat+0.009,city.lon], # offset slightly from the CBD
draw_control=False,
measure_control=False,
fullscreen_control=False,
attribution_control=False,
zoom_control=False,
scrollWheelZoom=True,
dragging=False)
The autoreload extension is already loaded. To reload it, use: %reload_ext autoreload
# compare left (OpenStreetMap) and right (Google) building footprints
w.split_map(left_layer="OpenStreetMap",
right_layer="ROADMAP",
left_label="OpenStreetMap",
right_label="Google")
w
Enter Microsoft
To make up the difference, wombat combines the OSM building footprints with footprints generated by Microsoft from aerial imagery using AI. They also have a similar project for road detection.
They report very good results:
| Metric | Value |
|---|---|
| Precision | 98.59% |
| Recall | 64.95% |
| IoU | Shape distance | Rotation error [deg] |
|---|---|---|
| 0.79 | 0.44 | 4.46 |
| Error category | 35.05% Gap |
|---|---|
| Very small buildings | 15.4% |
| Connected buildings | 14.0% |
| DNN | 2.8% |
| Various | 2.1% |
| Polygonization | 0.7% |
The estimate ~1% false postive ratio in 1000 randomly sampled buildings from the entire output corpus. More details here.
Let's now check how this looks in Wombat.
Integration Into Wombat (Microsoft + OSM)
# restart
w = wombat.Wombat(dataset_path=os.environ['WOMBAT_DATA_PATH'])
w.set_city("Brisbane")
w.Buildings.load(load_osm=True, # load OSM building footprints for city selected
load_msft=True, # load MSFT building footprints for city selected
load_combined=False) # combined building footprints ( OSM ∪ Microsoft)
Setting: Brisbane > [ BUILDINGS ] Loading Microsoft... > [ BUILDINGS ] Loading OSM...
Note, the buildings being loaded are being drawn from a custom geojson files that consist of all objects within the SA3 boundary of a given city. See the section on Boundary for more detail.
# we can calculate the
w.Buildings.calc_overlaps()
> [ BUILDINGS ] Calculating overlaps... > [ BUILDINGS ] Calculating non-overlaps... > [ BUILDINGS ] Percent Objects Overlap: 1.33
# buildings in Microsoft dataset NOT in OSM dataset
w.Buildings.buildings_msft_not_in_osm
| id | is_osm | geometry | |
|---|---|---|---|
| 0 | 0 | False | POLYGON ((152.22450 -26.90248, 152.22431 -26.9... |
| 1 | 1 | False | POLYGON ((152.27290 -26.98819, 152.27299 -26.9... |
| 2 | 2 | False | POLYGON ((152.28372 -26.89451, 152.28384 -26.8... |
| 3 | 3 | False | POLYGON ((152.28873 -26.89542, 152.28877 -26.8... |
| 4 | 4 | False | POLYGON ((152.32116 -26.57606, 152.32117 -26.5... |
| ... | ... | ... | ... |
| 986218 | 986218 | False | POLYGON ((153.30060 -27.68641, 153.30062 -27.6... |
| 986219 | 986219 | False | POLYGON ((153.30959 -27.69305, 153.30976 -27.6... |
| 986220 | 986220 | False | POLYGON ((153.31708 -27.68730, 153.31707 -27.6... |
| 986221 | 986221 | False | POLYGON ((153.38573 -27.70633, 153.38572 -27.7... |
| 986222 | 986222 | False | POLYGON ((153.38971 -27.69086, 153.38985 -27.6... |
878207 rows × 3 columns
# buildings overall ( intersection: OSM ∪ Microsoft)
w.Buildings.buildings
| id | is_osm | geometry | |
|---|---|---|---|
| 0 | 4282941 | True | POLYGON ((153.12079 -27.38351, 153.12088 -27.3... |
| 1 | 8040447 | True | POLYGON ((153.02759 -27.47551, 153.02767 -27.4... |
| 2 | 8040448 | True | POLYGON ((153.02812 -27.47568, 153.02821 -27.4... |
| 3 | 8040449 | True | POLYGON ((153.02770 -27.47632, 153.02755 -27.4... |
| 4 | 8040451 | True | POLYGON ((153.02762 -27.47632, 153.02746 -27.4... |
| ... | ... | ... | ... |
| 986218 | 986218 | False | POLYGON ((153.30060 -27.68641, 153.30062 -27.6... |
| 986219 | 986219 | False | POLYGON ((153.30959 -27.69305, 153.30976 -27.6... |
| 986220 | 986220 | False | POLYGON ((153.31708 -27.68730, 153.31707 -27.6... |
| 986221 | 986221 | False | POLYGON ((153.38573 -27.70633, 153.38572 -27.7... |
| 986222 | 986222 | False | POLYGON ((153.38971 -27.69086, 153.38985 -27.6... |
1042597 rows × 3 columns
# check out a region of the city to compare the Microsoft (blue) vs. the OpenStreetMap building footprints
w.Buildings.add_buildings(w,which='all',
nbuildings=None,
bounding_box=True,
bbox_width=2,
center_latlon=[city.lat+0.1,city.lon])
Performing Integration For Each City
This exercise involves the following steps:
- Load the OSM buildings (via pyrosm) for a specific Greater Capital City area.
- Get buildings from the bounded region.
- Get Microsoft's inferred buildings for the same region.
- Calculate which buildings are not in the OSM GCC area.
- Output a merged list of buildings for each GCC area.
We want to take the OSM structures as a first priority and only fill out with those from the Microsoft dataset. The OSM structures are higher quality, especially in the densely packed CBD regions and so this is a nice complementary method that plays to both of the source's strengths.
from datetime import datetime
current_date = datetime.now()
cdate = current_date.isoformat().split("T")[0]
cdate
'2023-08-27'
data = []
for city in wombat.capitals:
w.set_city(city)
w.Buildings.load(load_osm=True, # load OSM building footprints for city selected
load_msft=True, # load MSFT building footprints for city selected
load_combined=True) # load combined building footprints ( OSM ∪ Microsoft)
num_osm = w.Buildings.buildings_osm.shape[0]
num_msft = w.Buildings.buildings_msft.shape[0]
num_unique_combined = w.Buildings.buildings.shape[0]
frac_overlap = num_osm/num_msft
item = {"City":city,
"Number (OSM)":num_osm,
"Number (MSFT)":num_msft,
"Union":num_unique_combined,
"Overlap":round(frac_overlap,2),
"Filename":os.path.basename(w.Buildings.combined_footprints_filename),
"Updated": cdate}
data.append(item)
Setting: Brisbane > [ BUILDINGS ] Loading Microsoft... > [ BUILDINGS ] Loading OSM... > [ BUILDINGS ] Loading combined footprints... Setting: Sydney > [ BUILDINGS ] Loading Microsoft... > [ BUILDINGS ] Loading OSM... > [ BUILDINGS ] Loading combined footprints... Setting: Melbourne > [ BUILDINGS ] Loading Microsoft... > [ BUILDINGS ] Loading OSM... > [ BUILDINGS ] Loading combined footprints... Setting: Hobart > [ BUILDINGS ] Loading Microsoft... > [ BUILDINGS ] Loading OSM... > [ BUILDINGS ] Loading combined footprints... Setting: Adelaide > [ BUILDINGS ] Loading Microsoft... > [ BUILDINGS ] Loading OSM... > [ BUILDINGS ] Loading combined footprints... Setting: Darwin > [ BUILDINGS ] Loading Microsoft... > [ BUILDINGS ] Loading OSM... > [ BUILDINGS ] Loading combined footprints... Setting: Canberra > [ BUILDINGS ] Loading Microsoft... > [ BUILDINGS ] Loading OSM... > [ BUILDINGS ] Loading combined footprints... Setting: Perth > [ BUILDINGS ] Loading Microsoft... > [ BUILDINGS ] Loading OSM... > [ BUILDINGS ] Loading combined footprints...
import pandas as pd
pd.DataFrame(data).set_index("City").sort_values("Overlap")
| Number (OSM) | Number (MSFT) | Union | Overlap | Filename | Updated | |
|---|---|---|---|---|---|---|
| City | ||||||
| Brisbane | 164390 | 986223 | 1042597 | 0.17 | Brisbane.geojson | 2023-08-27 |
| Perth | 154828 | 798880 | 821089 | 0.19 | Perth.geojson | 2023-08-27 |
| Sydney | 328831 | 1271291 | 1402473 | 0.26 | Sydney.geojson | 2023-08-27 |
| Canberra | 36642 | 142426 | 154338 | 0.26 | Canberra.geojson | 2023-08-27 |
| Darwin | 15140 | 53370 | 55604 | 0.28 | Darwin.geojson | 2023-08-27 |
| Melbourne | 537634 | 1654907 | 1870734 | 0.32 | Melbourne.geojson | 2023-08-27 |
| Adelaide | 218158 | 561012 | 590700 | 0.39 | Adelaide.geojson | 2023-08-27 |
| Hobart | 117141 | 120479 | 147613 | 0.97 | Hobart.geojson | 2023-08-27 |
These data will enable the statistical calculations of packages like urbanity to be much more faithfully representative of the regions being studied. More to come soon.
Overture Maps
During the course of preparing this documentation, Overture Maps has released a phenomenal dataset of places, buildings and roads of the entire plant. The dataset is ~200GB and is accessible either via a AWS/Azure query or direct download (parquet). The buildings component of what they have produced, seems to be similar same methodology as described above (OSM + Microsoft), except done on the entire planet.
Head to the Overture Maps Notebook for an explainer on how this data has now been incorporated into wombat.
If you'd like to see the Overture data yourself, check out these instructions.